
Weather Maps
Visualize weather anywhere in the world with high-quality map layers for radar, satellite, precipitation, cloudiness, temperature, wind and more. Tiles are 256x256 PNGs compatible with common map libraries such as OpenStreetMap, Leaflet, MapLibre and Google Maps. All required and optional parameters are given as path and query parameters respectively. To obtain images one must first request an access token using valid credentials. The access token can then be used to fetch capabilities-response, which contains information on how to fetch images. Image size is 256x256 pixels. Precipitation types on radar layers include rain, sleet, and snow.
Get an API key OpenAPI spec for AI assistants
Full API reference — quickstart, authentication, request limits and attribution.
Visualize weather anywhere in the world with high-quality map layers for radar, satellite, precipitation, cloudiness, temperature, wind and more. Tiles are 256x256 PNGs compatible with common map libraries such as OpenStreetMap, Leaflet, MapLibre and Google Maps. All required and optional parameters are given as path and query parameters respectively.
To obtain images one must first request an access token using valid credentials. The access token can then be used to fetch capabilities-response, which contains information on how to fetch images.
Image size is 256x256 pixels. Precipitation types on radar layers include rain, sleet, and snow.
Available standard map layers
43+ standard layers are available — precipitation radar, satellite, temperature, wind, air quality, pollen and more — across global and regional coverage. Each is served as 256×256 tiles.
Zoom levels correspond to Google Maps zoom levels. Global region latitudes: minLat: -73, maxLat: 73, minLon: -180, maxLon: 180
The Map API delivers maps as a grid of individual images called tiles. Usage is measured based on the number of tiles served to your application — each tile counts as one API request.
To significantly reduce the amount of data your browser requests and speed up map loading, we recommend caching map tiles. This means your browser will temporarily store recently viewed map sections. The duration of this storage depends on how often the map data updates. For example, frequently changing data like radar updates are cached for shorter periods than less frequent updates like temperature. By caching, you'll experience faster map performance and lower data usage.
Endpoints
Capabilities
Capabilities endpoint is used to fetch layer metadata. This metadata is used to perform image queries. Capabilities-response provides layer information such as description, temporal and spatial extents as well as available color schemes.
Images are layers renderable to image formats such as png or svg. The current data property in time element is the index to the most recent available time.
Image products may have additional color schemes which can be optionally specified. Several layers have transparency in the color scheme by default, enabling them to be overlaid directly onto a map. Alternatively, we also offer non-transparent color schemes when only the details of the map – like country borders, roads and city names – are to be placed on top of the weather layer. If an alternative color scheme is available, you can find it in the capabilities endpoint.
Query Parameters
tokenType: stringrequiredAccess token as provided by authorization endpoint
/api/v1/capabilitiesShell Curlcurl 'https://weatherapi.foreca.net/api/v1/capabilities' \
--header 'Authorization: Bearer YOUR_SECRET_TOKEN'{
"images": [
{
"id": 2,
"attribution": null,
"title": "Temperature",
"description": "Global surface temperature",
"formats": [
"image/png"
],
"colorschemes": [
"default"
],
"times": {
"updated": "2022-01-27T00:00:00Z",
"available": [
"2022-01-27T06:00:00Z"
],
"current": 33
},
"analysis": "20240222000000",
"extent": {
"minLat": -90,
"maxLat": 90,
"minLon": -180,
"maxLon": 180,
"minZoom": 2,
"maxZoom": 14
}
}
]
}{
"type": "object",
"properties": {
"images": {
"type": "array",
"items": {
"type": "object",
"properties": {
"id": {
"type": "number",
"example": 2
},
"attribution": {
"type": "string",
"nullable": true
},
"title": {
"type": "string",
"example": "Temperature"
},
"description": {
"type": "string",
"example": "Global surface temperature"
},
"formats": {
"type": "array",
"items": {
"type": "string",
"example": "image/png"
}
},
"colorschemes": {
"type": "array",
"items": {
"type": "string",
"example": "default"
}
},
"times": {
"type": "object",
"properties": {
"updated": {
"type": "string",
"example": "2022-01-27T00:00:00Z"
},
"available": {
"type": "array",
"items": {
"type": "string",
"example": "2022-01-27T06:00:00Z"
}
},
"current": {
"type": "number",
"example": 33
}
}
},
"analysis": {
"type": "string",
"example": "20240222000000"
},
"extent": {
"type": "object",
"properties": {
"minLat": {
"type": "number",
"example": -90
},
"maxLat": {
"type": "number",
"example": 90
},
"minLon": {
"type": "number",
"example": -180
},
"maxLon": {
"type": "number",
"example": 180
},
"minZoom": {
"type": "number",
"example": 2
},
"maxZoom": {
"type": "number",
"example": 14
}
}
}
}
}
}
}
}Tile
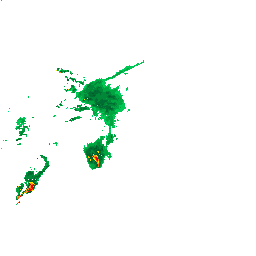
Tile endpoint is used to obtain weather map tiles (size 256x256) for the given layer and color scheme.
Example response
Path Parameters
idType: stringrequiredLayer id
xType: stringrequiredX index of the requested tile
yType: stringrequiredY index of the requested tile
zType: stringrequiredZoom level of the requested tile
timeType: stringrequiredUTC timestamp value for the data to retrieve in ISO 8601 format. Must appear in the available times list
Query Parameters
tokenType: stringrequiredAccess token as provided by authorization endpoint
colorschemeType: stringLayer color scheme. Must appear in the color scheme list returned by capabilities endpoint
updatedType: stringInclude the updated timestamp as an optional query parameter when requesting rapidly updating layers to prevent fetching tiles from outdated analyses.
analysesType: stringInclude the analyses timestamps as an optional query parameter when requesting rapidly updating radar layers to prevent fetching tiles from outdated analyses
windunitType: stringWind speed unit on the wind symbol map layer. Supported values: ms (m/s, the default), knots, kmh (km/hour), or mph (miles/hour).
/api/v1/image/tile/{z}/{x}/{y}/{time}/{id}Shell Curlcurl 'https://weatherapi.foreca.net/api/v1/image/tile/{z}/{x}/{y}/{time}/{id}' \
--header 'Authorization: Bearer YOUR_SECRET_TOKEN'Symbol
Symbol endpoint serves compact multi‑location forecast "symbol tiles" for three modes: current, hourly, and daily. Parameters x, y and z have the same meaning as in the Tile endpoint. Symbol endpoint returns a JSON tile with per‑location current or forecast timesteps including temperature and weather symbol codes, designed for use as map overlays with minimal payload.
Path Parameters
modeType: stringrequiredOne of: "current" for the nearest full hour, or "hourly" or "daily" for forecasts. The forecasts cover five days, that is, 120 hourly or 5 daily timesteps
Query Parameters
xType: stringrequiredX index of the requested JSON tile
yType: stringrequiredY index of the requested JSON tile
zType: stringrequiredZoom level of the requested JSON tile. Valid range: 3..12
unitsType: stringUse units=C for Celsius or units=F for Fahrenheit. Default: units=C
wrapType: stringUse wrap=1 for automatic horizontal wrapping of tiles. It makes x = x % (max(x) + 1), where max(x) is the maximum x on the selected zoom level (z). Default: wrap=0
/api/v1/symbol/{mode}Shell Curlcurl 'https://weatherapi.foreca.net/api/v1/symbol/{mode}' \
--header 'Authorization: Bearer YOUR_SECRET_TOKEN'{
"locations": [
{
"city": "Tampere",
"id": 100634963,
"lat": "61.499114990",
"lon": "23.787117004",
"timesteps": [
{
"symbol": "n400",
"temperature": 4.72,
"time": "2025-12-03T14:00"
}
]
}
]
}{
"type": "object",
"properties": {
"locations": {
"type": "array",
"items": {
"type": "object",
"properties": {
"city": {
"type": "string",
"example": "Tampere",
"description": "City name"
},
"id": {
"type": "number",
"example": 100634963,
"description": "Location id"
},
"lat": {
"type": "string",
"example": "61.499114990",
"description": "Latitude (decimal degrees)"
},
"lon": {
"type": "string",
"example": "23.787117004",
"description": "Longitude (decimal degrees)"
},
"timesteps": {
"type": "array",
"items": {
"type": "object",
"properties": {
"symbol": {
"type": "string",
"example": "n400",
"description": "Weather symbol code (see symbol codes in \"Resources\")"
},
"temperature": {
"type": "number",
"example": 4.72,
"description": "Air temperature (units according to units parameter)"
},
"time": {
"type": "string",
"example": "2025-12-03T14:00",
"description": "UTC date and time (for current or hourly mode), or date (for daily mode) of the JSON tile, in ISO 8601 format"
}
}
},
"description": "Array of timestep objects (length depends on mode)"
}
}
}
}
}
}Legend
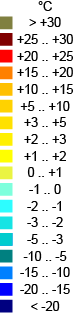
Legend endpoint is used to obtain legend image for a color scheme
Example response
Path Parameters
colorschemeType: stringrequiredColor scheme id. Must appear in the color scheme list returned by capabilities endpoint
idType: stringrequiredLayer id
Query Parameters
tokenType: stringrequiredAccess token as provided by authorization endpoint
/api/v1/legend/{colorscheme}/{id}Shell Curlcurl 'https://weatherapi.foreca.net/api/v1/legend/{colorscheme}/{id}' \
--header 'Authorization: Bearer YOUR_SECRET_TOKEN'